
Pathways

Two gauge meters with red, yellow, and black sections, indicating levels, are positioned above a line chart illustrating the comparison of two datasets. The chart shows two lines labeled 'Dataset 1' and 'Dataset 2', with 'Dataset 1' higher than 'Dataset 2' over the same period.

Events

Black and white clip art of a dollar sign with a speech bubble

Performance

Illustration of a person running with a circular gauge above their head showing yellow and red zones.
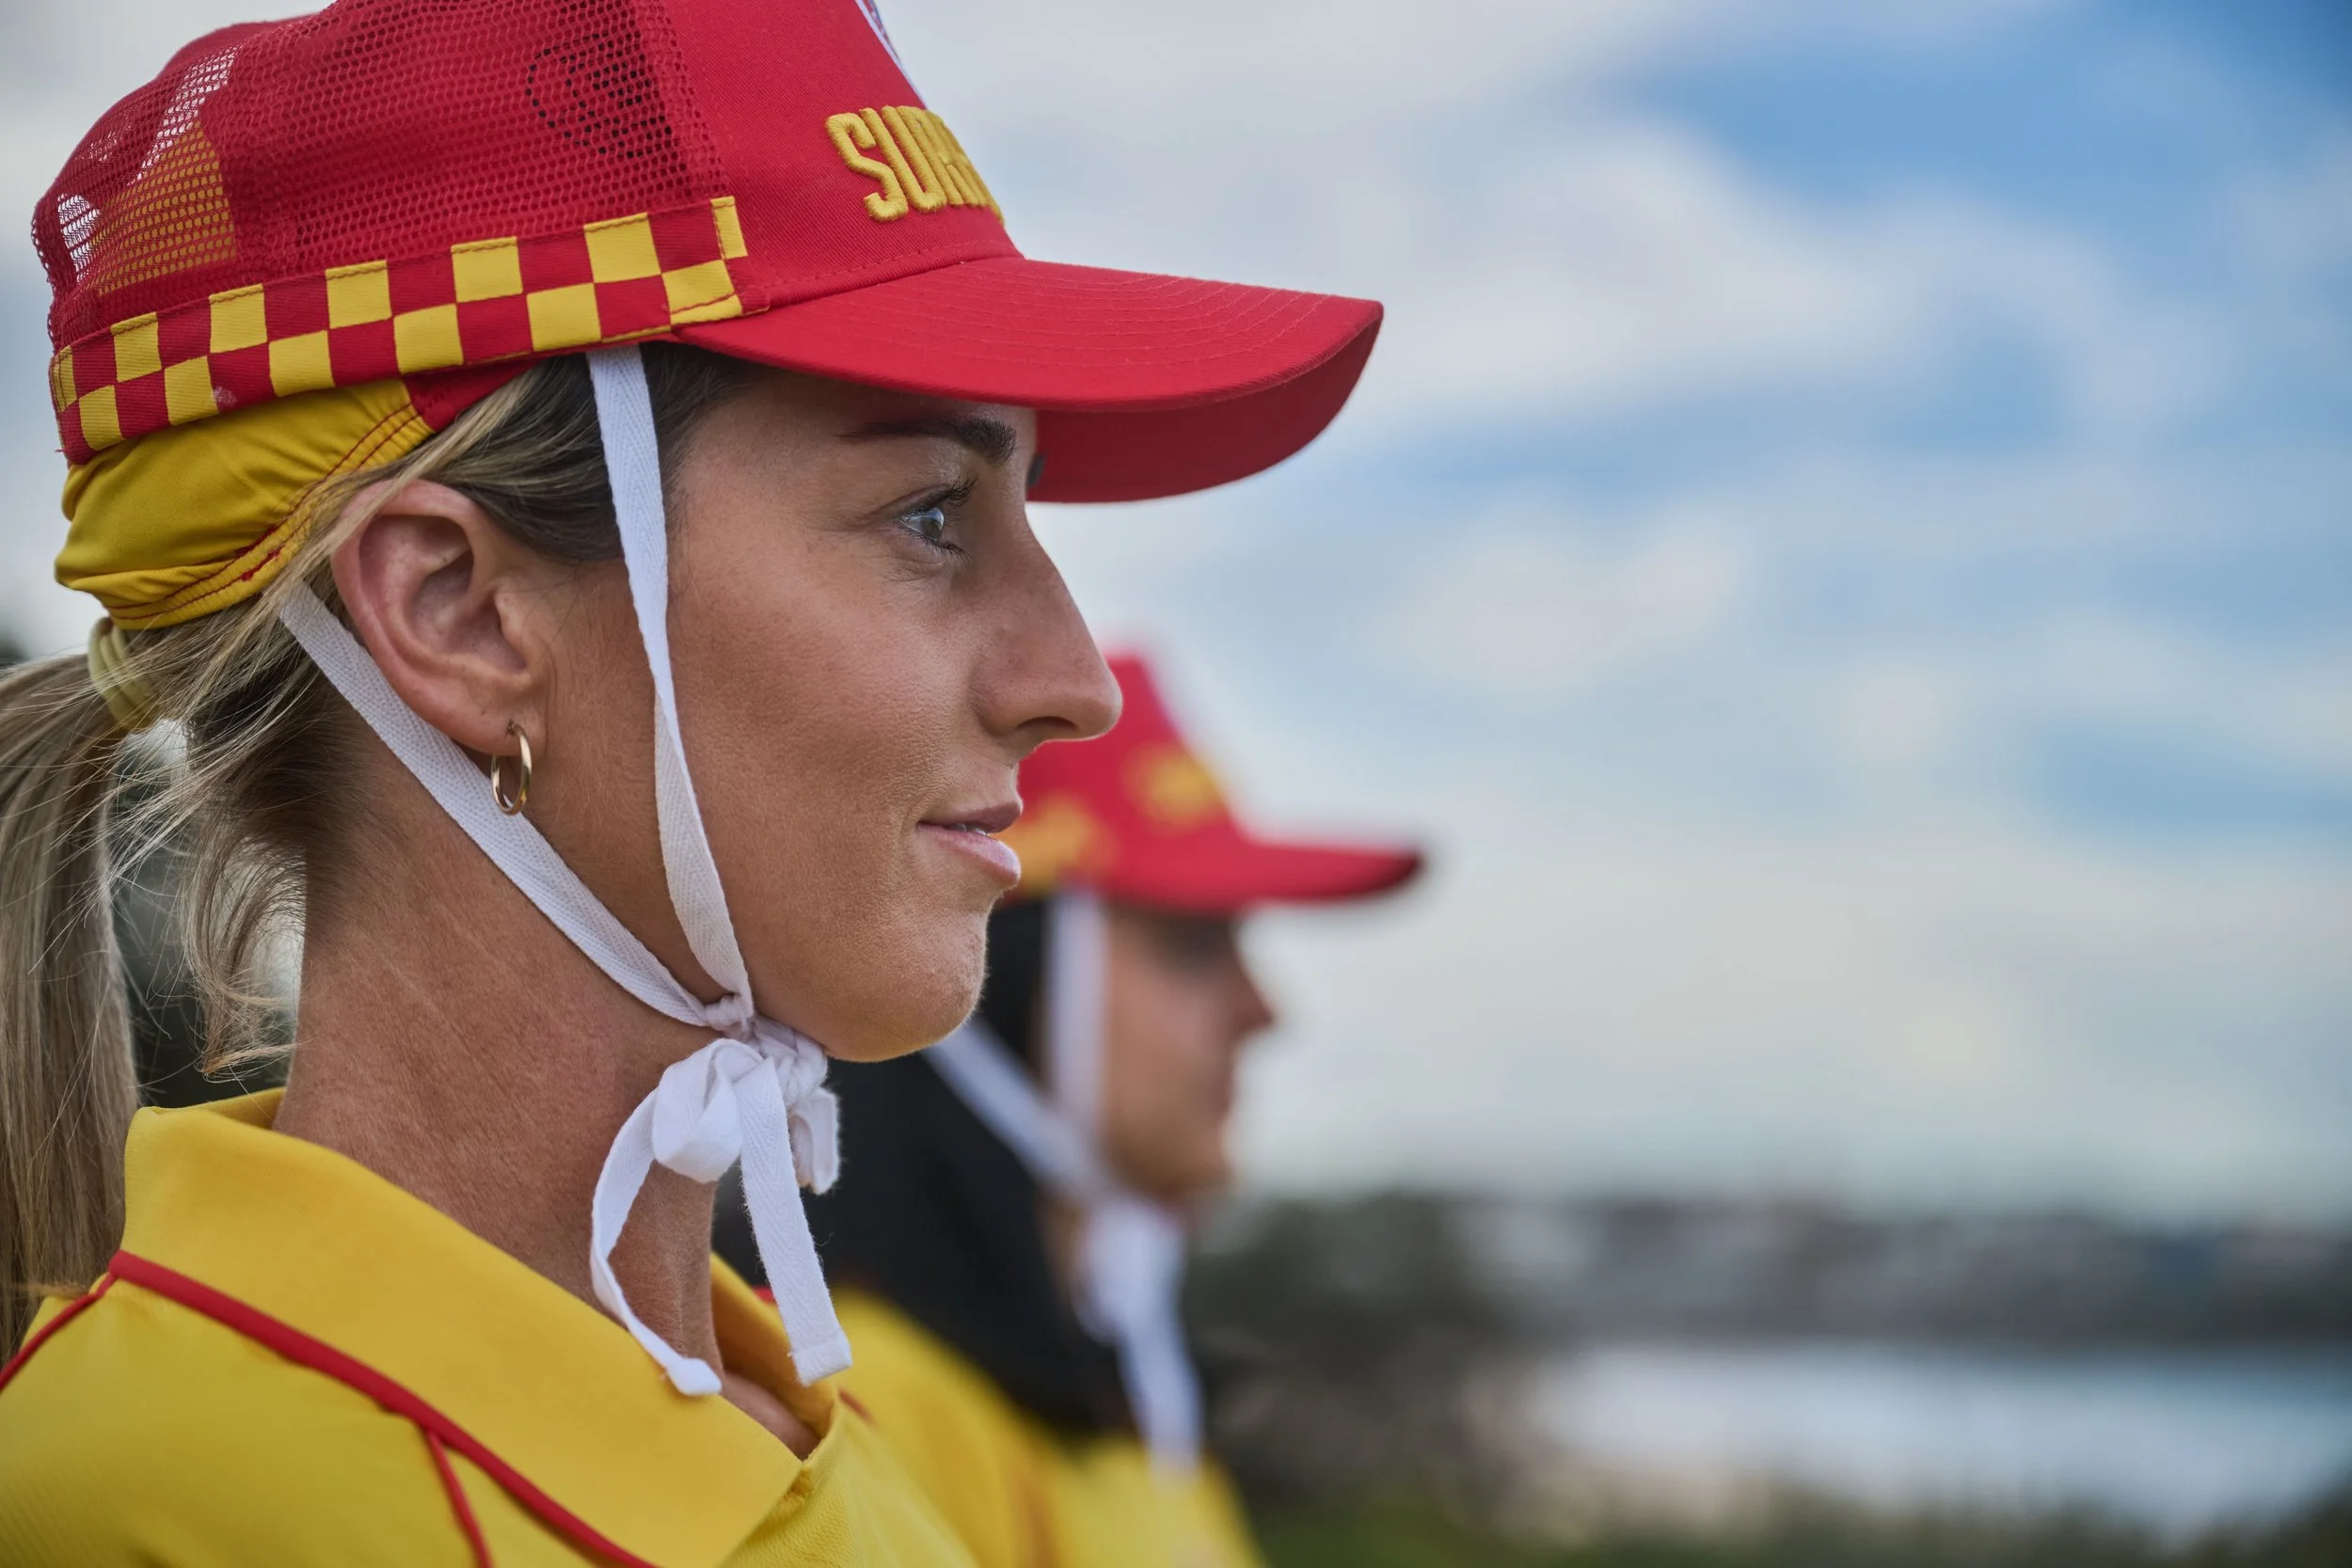
Close-up of a woman wearing a red and yellow cap with the word 'SUR' visible, standing outdoors in a line with other women similarly dressed, possibly at a sports or event ceremony.

Surf Sports
Pathways

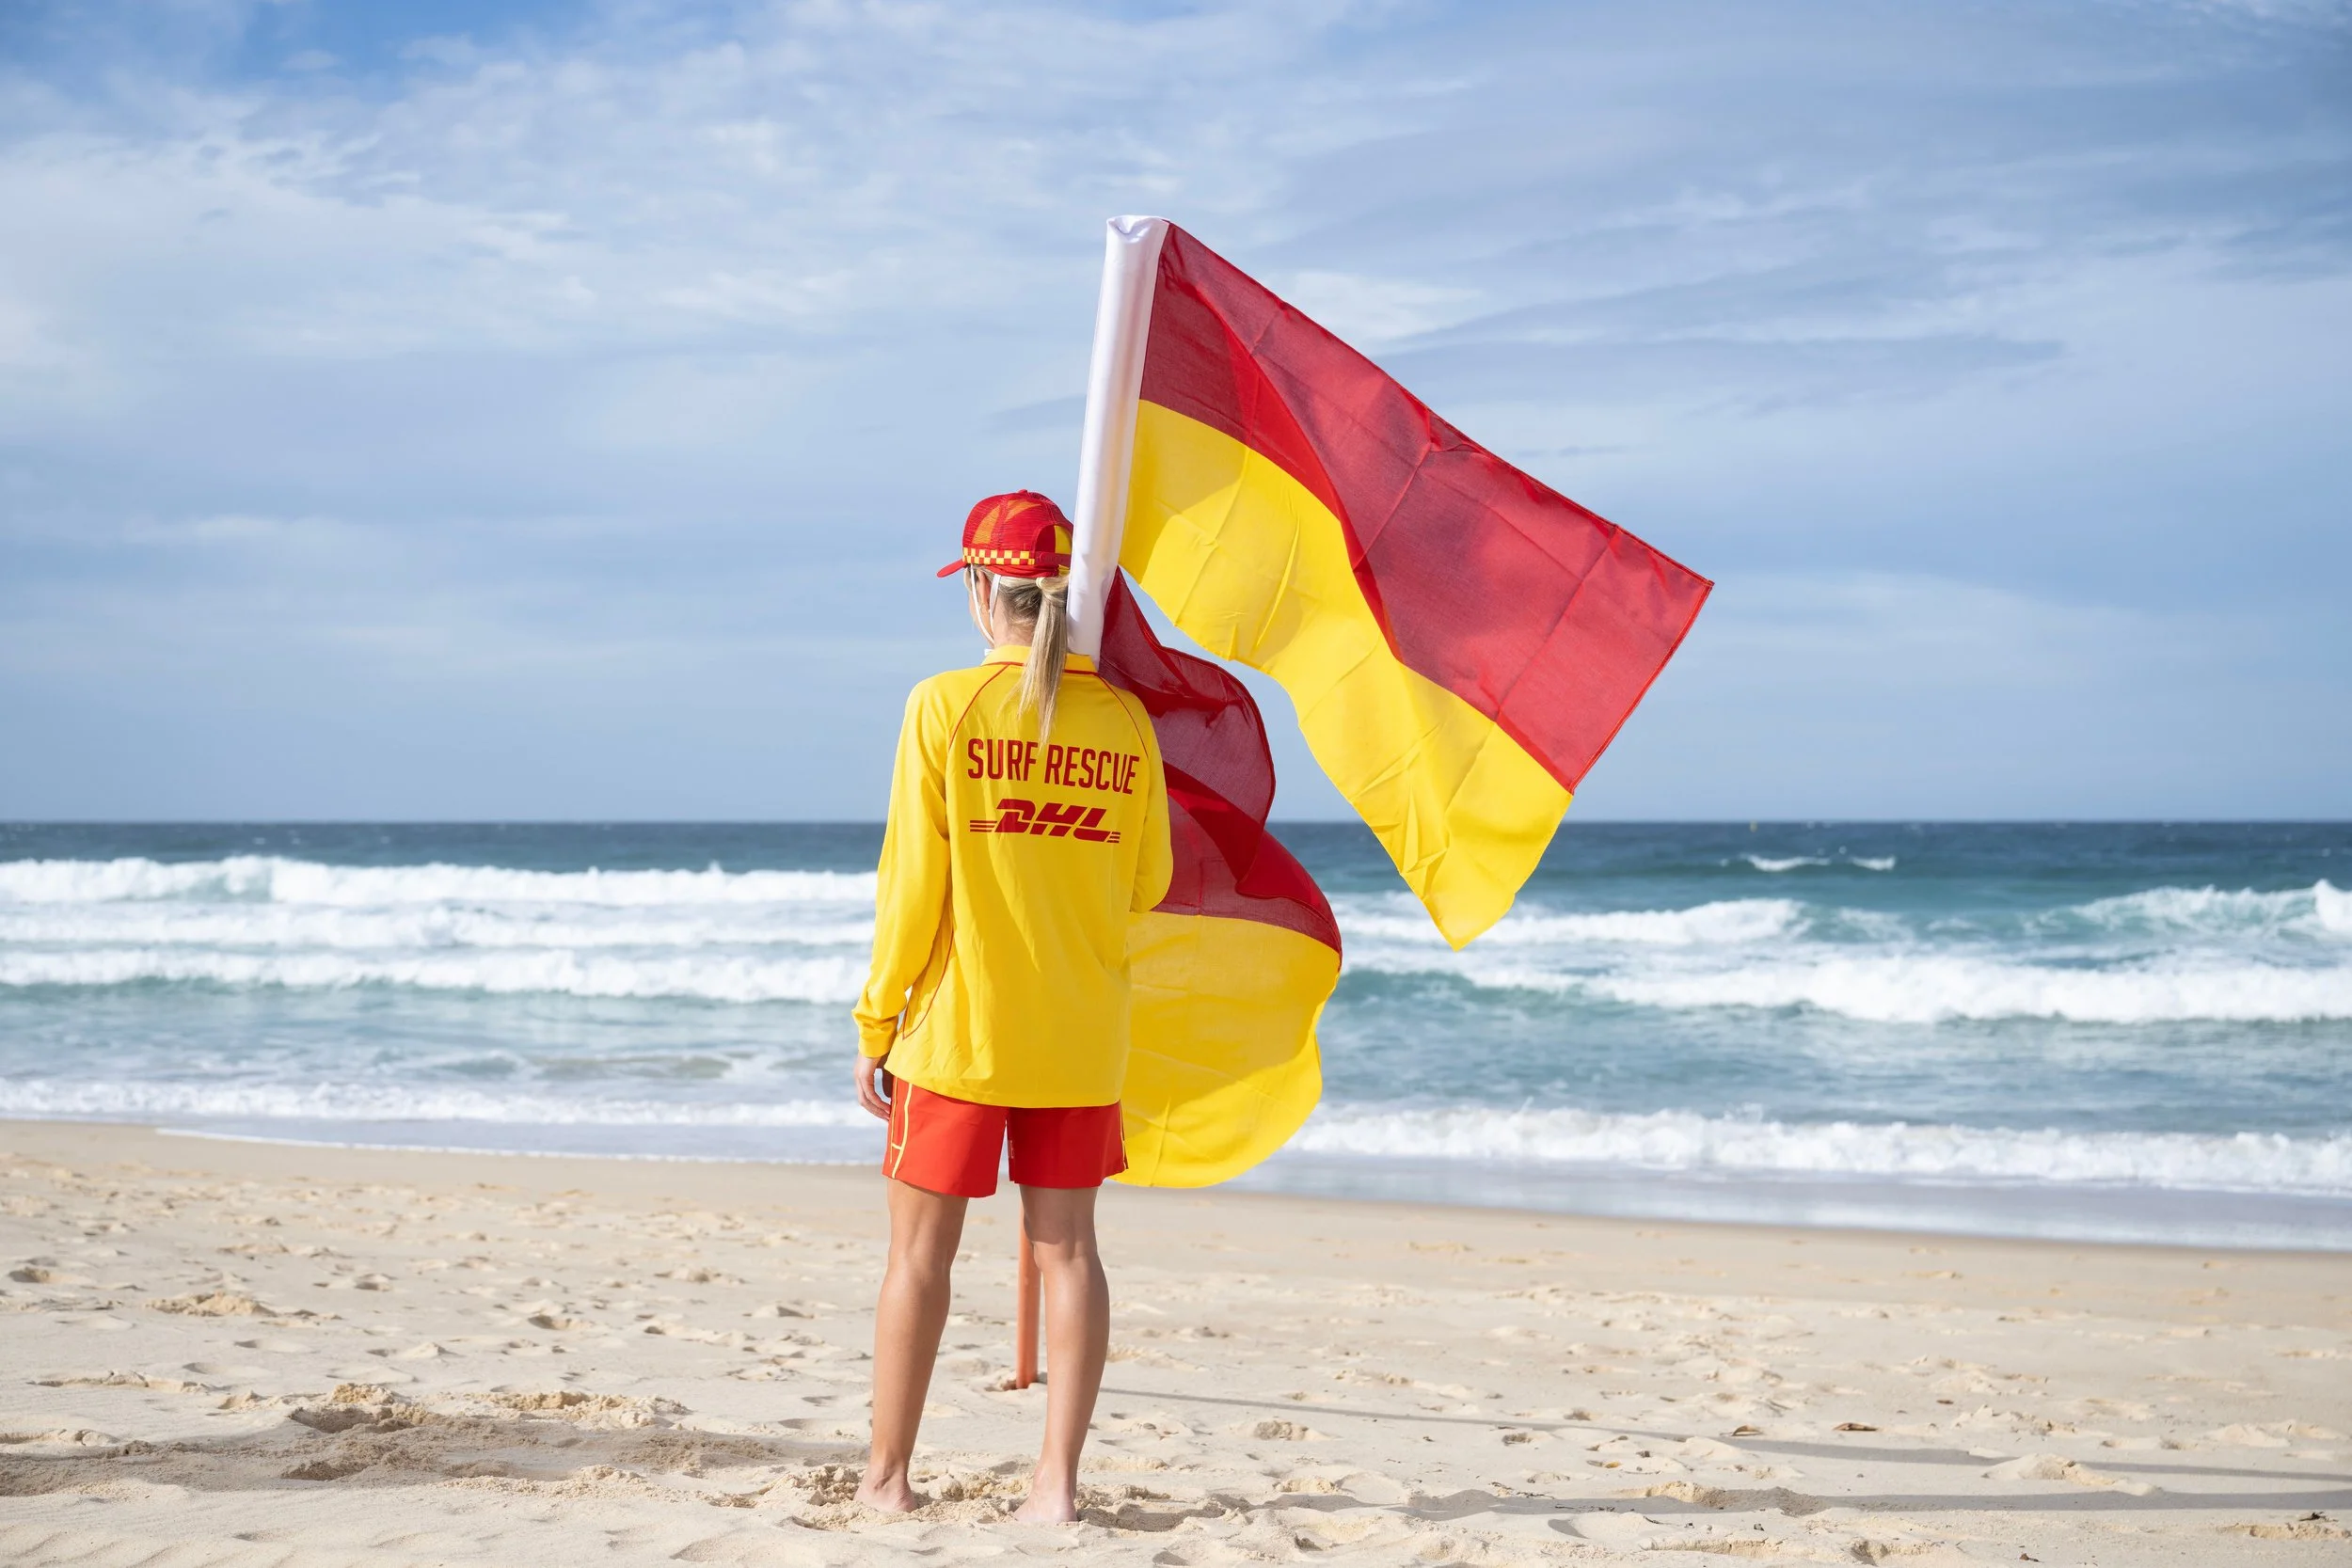
A lifeguard in yellow uniform with red shorts standing on a sandy beach near the ocean, holding a red and yellow flag, with Ocean waves and a partly cloudy sky in the background.

Surf Sports
Calendar